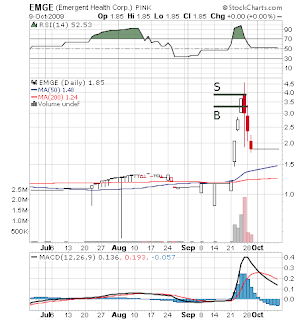
This is a winning trade on EMGE, most likely a short trade-- the stock was down on the day. According to info on TimothySykes.com, Tim sold at $3.88 and covered at $3.20. Looking at the chart, a red candle in combination with an increase in volume provides a very strong bearish indicator, but when the trade was placed, it was not clear what the final volume for the day would be. The trade was entered and exited on the very day the previously bullish trend broke down and the decision to sell short must have been based on intra-day indicators and/or fundamental data.
Комментариев нет:
Отправить комментарий