Показаны сообщения с ярлыком IMDS. Показать все сообщения

среда, 25 ноября 2009 г.

IMDS rallied Nov 24, 2009. Looks ripe for another correction.

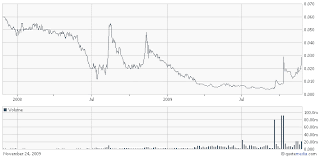
IMDS long range
IMDS day chart
IMDS 5min chart
IMDS made a second big jump in row; the stock seems to fit what Tim Sykes calls Stair Stepper pattern in his educational video -- although he rarely if ever trades stocks this cheap. It's common for such stocks to pull back after such events. It's interesting that in the 5-min chart, the rally is seen to be basically dominated by the first 15 minutes of trading. In the long range chart, the historical highs for IMDS are still way up, while the slow but steady growth in volume looks promising.

среда, 14 октября 2009 г.

IMDS on Oct 13, 2009: watching the action

After seeing the IMDS action on the day before, Oct 12, I said in a private communication that I expected the stock to consolidate between 0.02 and 0.03 and then to perhaps make another jump a few days later. So far I am right, here is the IMDS chart up to and including Oct 13:

IMDS chart Oct 13, 2009

This type of pattern puts IMDS into the "stair-stepper" class. The intra-day (5 min) chart below shows what happened yesterday:
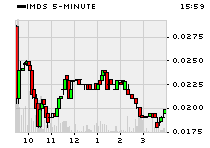
IMDS 5 min chart Oct 13

The first few minutes after the opening bell were fun to watch, with traders running in droves to sell the stock. I don't know how many people were taking profit and how many were trying to short the stock, but the price action was quite predictable. When the stock hit the 0.02 level (losing 1/3 off the previous day's close) my brain told me I should buy it -- but I did not trust this voice and did nothing on that day. About 10% of day's trading volume was made in the first five minutes. You can see volume dying off in the intra-day chart.