понедельник, 28 декабря 2009 г.

Tim Sykes' ATHX trade, Dec 23, 2009

ATHX intraday chart
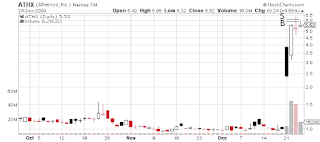
ATHX day chart Tim Sykes trade
This is the ATHX trade as posted on Tim Sykes' front page: Tim bought at $5.88, sold at $6.04. However, based on Tim's posts, it looks like the story was more complex with more individual trades -- but TimAlert subscribes were kept up-to-date.

As is often the case, the time scale of these trades is finer than is resolved on the day chart. The bottom line is that I learn very little here -- except that this is the type of a stock event that triggers a speculative trader's attention -- which is obvious.

среда, 23 декабря 2009 г.

Tim Sykes' IFNY trade, Dec 21, 2009

IFNY day chart Tim Sykes trade
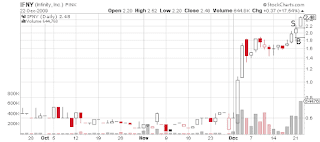
This is Tim's second trade in this stock in December (see the previous one). Again not sure whether this is a long or short, but judging from the posts on his site (responses from TimAlert subscribers) the sentiment was bullish this time, and the trade idea was out already on Friday. Tim bought at $1.85, sold at $2.17 -- a profitable trade.

Tim Sykes' SNSS trade, Dec 16, 2009

SNSS day chart Tim Sykes
Another winning trade in SNSS, closed Dec 16. As you see, the trade took advantage of only a fraction of the day's range; most likely this is a short -- but one has to see intra-day data; the scale of price change (sold at $1.71, bought at $1.67) corresponds to the daily scalping time scale, given the overall volatility of the stock.

Tim Sykes' SNSS trade, Dec 15, 2009

SNSS day chart Tim Sykes trade
A successful short trade; Tim sold at $1.99, covered at $1.85. The date he publishes on his site is the date the trade is closed; looking at the chart, one can guess when the trade was entered: most likely, the day before. In that case, the decision must have been influenced by the stock's intra-day dynamics the day before, which shows up on the day chart in the peculiarity of the day candle on the day the stock made a top.

понедельник, 21 декабря 2009 г.

Tim Sykes' RWC trade, Dec 10, 2009

RWC day chart Tim Sykes trade
This one just looks like bad luck. Most likely the intention was to short the stock, and the overall trend agrees with that, but the timing looks wrong -- or rather, the stop-loss chosen is too tight for these volatile stocks. Sold at $3.89, bought at $4.12, .

Tim Sykes' LZB trade, Dec 9, 2009

LZB day chart Tim Sykes trade
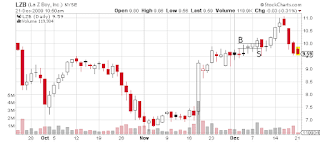
This trade was a loss. I find some of Tim's losing trades just as instructive as the winning ones to look at. Perhaps I should classify these little posts according to whether the trade was a win or a loss, in addition to ticker and market. Can't think of a reason for a technical, short-term speculator to open a position in this stock around Dec.9 -- which is when the position was closed according to Tim's log on his site. According to his log, the buy level was $10, sell $9.82.

Tim Sykes' BIOF trade, Dec 7, 2009

BIOF day chart Time Sykes trade
This trade was a loss; technically (with the benefit of hind-sight of course) I don't see a compelling reason to short this stock on Dec 7 -- it's not clear though that this when the short position was opened. It's possible that the short was opened the day before. According to Tim's log, the buy level was $3.06, sell $2.92.

Tim Sykes' IFNY trade, Dec 7, 2009

IFNY day chart Tim Sykes trade

This is one of those trades where one misses the intra-day data -- the scale of the trade (both time- and dollar-wise) looks lost in the chart. Judging from Tim's comments on his site, this was a short. Sold short at $1.50, bought to cover at $1.47. Nevertheless, the context in which the trade was placed is clear -- it is also clear after the fact that one should have been buying. But Tim managed to extract a bit of a profit out of this trade.

вторник, 15 декабря 2009 г.

Russian sociologist Andrei Fursov on the "tasks" of the financial crisis

I've found this recent (appeared yesterday) and thought provoking piece of analysis by Fursov on russia.ru. Translating from the Russian:

The tasks of the financial crisis


In the recent months people say more and more often that the crisis is abating, that the remission has come, that the crisis was not too dangerous, that now one can take a breather and stop worrying.

To me, this resembles one familiar story about a boy and the wolves. The boy used to cry "Wolf!", but there were no wolves, people stopped believing him, and when the real wolves showed up, nobody came and the wolves ate the cattle. This resembles today's situation when people are comforting themselves. At first people cried -- "Crisis, crisis!" -- yes, certain phenomena of a crisis took place. Indeed, there were bank mergers, at the same time with other events. For example, there is a lot of talk about swine flu and I believe that's a good distraction -- it draws people's attention away from the crisis, letting other people make some money, but that's a different problem. The main thing is that despite the fact that many new topics appeared recently in the media and along with the talk about the crisis being "not that strong", the topic of the crisis is fading away -- I agree with those economists who believe that the present calm is temporary and the crisis will strike for real in 2014-2015 and that wave will be a lot more serious. Whether this is so we will see, but another question is interesting. This crisis -- to what extent is it "natural" and to what extent is it man-made? Looking at practically all major economic crises of the XXth century, in particular the Great Depression, we see that they are all man-made. And a very simple question can be asked, the way Romans used to do it: "Qui Bono?" For example, what happened after the '29-33 crisis? As a result of that crisis, the financial capital bancrupted small and medium banks, expropriated their assets, and largely put the political life in the US and in the world at large under its own control. That was the main result of the Great Depression and as Carroll Quigley wrote in his remarkable work on the history of the first half of the XXth century, in '29-33, the march of the financial capital to the political power, the march that began in 1870s and had the formation of the FRS as its milestone, has finished with a triumph -- and Carroll Quigley applauded that.

And if we look back at that crisis, it's all quite clear -- those lines, along which people would benefit, obtain privileges, accumulate wealth and so on. If we look at today's crisis, we see the same process, except for it's not the big fish eating the small ones, but super-large fish eating the large ones; large banks go bankrupt, and who is grabbing them? Well, for example, banks that belong to the Morgan family, who did a very good job in these few months during the crisis. Large banks go bust, but the super-large ones acquire their assets. So in reality it's the process of capital concentration that takes place, and that's one of the tasks of this crisis.

In fact, today's capitalist economy is a planned economy, it's not "free". Indeed, in many parts of today's economy there is no "market" at all. What market can you talk about in the natural gas industry? What market is there in the sphere of arms trade? Well of course a few dozen percent in almost every major sphere belong to "market", but in all other respects there are monopolies. It's for a reason that French historian Baudelle used to say: "Capitalism is the enemy of the free market". That's because in the market, capitalists struggle for the monopoly and one should say that the entire history of capitalism is, however paradoxal this might sound, is the struggle of the capitalist class against the market, in the market. The market is preserved as the battle field, but the goal of the battle is to limit the market and thus to finish its existence.

By the way, Attali wrote quite frankly about that in "A Brief History of the Future" where he wrote that the task of the world government which was going to establish its power over the world in the middle of the XXIst century would be to finish up the financial capital, to put it under control and to introduce the global distribution-based economy. And the shortest path towards the world government is the global currency; the shortest path towards the global currency is the global financial and economic crisis.

Thus the present crisis pursues a number of tasks, the tactical and mid-range ones. For example, I am deeply convinced that one of the tasks of the crisis was to slow down China, but this goal was not accomplished, because even though they did slow down China, the rest of national economies began to feel even worse, it's the non-national economies so to speak, who won. Besides, there is a lot of things we don't know, since the financial capital is a non-transparent thing -- it's known that the Morgans did grab some banks but we don't know exactly what the Rothschilds gained as a result of this shake-over, what the Rockefellers gained, we can only guess about some very serious tensions at the world's top, using a number of indirect indicators.

Obama, the Rockefellers' man, is understandably for the US dollar, while the Rothschilds and the Chinese back some other currency. Thus the world crisis, besides its visible aspects, has a very powerful hidden code and that hidden code has to do with the struggles within the world's capitalist class, about which little is known, which are not discussed in the press and on TV. The main fight is under the carpet. And in great many areas we can only form indirect inferences based on some visible movements, although the general direction of the crisis is completely clear -- it's towards concentration of the capital, the maximal concentration of the capital.

Even given that, the most interesting question is the following: suppose those who planned the crisis fully accomplish their goals, and concentrate the huge capitals in the hands of literally a few families. In such a situation, money stops making sense in general, since when money is concentrated in such a compressed form, it becomes power, pure power.

The character of Robert Penn Warren's novel, Willie Stark (his prototype was Huey Long, the Governor of Louisiana and a Roosevelt's rival, killed in '35) used to say: "Money makes sense up to a certain point, beyond which it's only power that makes sense".

I've got no smoking gun, but based on all I know from the history of the capitalist system, I have no doubt that the final result of the accumulation of enormous funds among very few owners will be an abolishment of those same funds and their transformation into sterile pure power, on the basis of which a completely different society will be formed, which is something Attali blabbed about: the financial capital is being put under control, is abolished, and an economy of distribution is established -- and the economy of distribution applies not only to the tangible goods -- it's information and resources, too. That is, an hierarchical structure of global control is established and in that respect this financial crisis of today is, I believe, one of the steps towards this new system.

Whether anything will come out of that is another question. History is ironic at times: for example, certain people in the early XXth century were planning to break Germany, Austro-Hungary, Russia, the Osman Empire apart as something which stood in the way of the financial capital's progress. Well, they did break apart the Osman Empire, they did break apart Austro-Hungary, they even broke apart Russia -- but in Russia's place a creature even more dangerous to the global financial capital emerged, the Soviet Union, the anti-capitalist camp. In other words, there are no linear moves in history, and quite often the people who start such fine multi-move games, these same people lose. We just have to see how the events will unfold in the future, but in order to understand what's going on, one has to, first, watch the events very carefully and second, to avoid getting fooled and to look at the world with one's own eyes and not with somebody else's.

четверг, 10 декабря 2009 г.

Tim Sykes' CLWT trade, Dec 2, 2009

CLWT day chart Tim Sykes
A winning short according to Tim's comments on his site (money could be made that day either way -- look at the day's high for the stock). It's interesting that based on Dec 1st performance, Tim commented that stock did not look tempting after late day collapse. So could it be the opening with the gap down that made it look tempting again next morning?

Tim Sykes' GRO trade, Dec 1, 2009

GRO day chart Tim Sykes trade
Another winning trade; on Tim's site, the trade is dated Dec.1 with buy at $3.20 and sell at $3.60. After looking at the chart, this is obviously a long trade entered most likely the day before. I am guessing but the key could have been intra-day dynamics on the day trade was entered -- most likely Monday, Nov.30. Just look at the volume spike on that day.

пятница, 4 декабря 2009 г.

Tim Sykes' DRAM trade, Nov 27, 2009

DRAM day chart Tim Sykes

This is a winning trade; looks like a short trade placed into a bearish trend. Tim sold at $4.17, bought at $3.78. On Nov 27, the stock opened with a gap down after a down day with a decreasing volume, which could have served as a signal -- but that's merely a guess. In that case, the trade was entered and exited on the same day.

Tim Sykes SEED trade, Nov 25, 2009

SEED day chart Tim Sykes
This short trade was a loss and I spent some time trying to figure out when exactly this trade could be entered. This definitely didn't work out like the AENY trade, although the pattern of entering the trade could be similar.

среда, 25 ноября 2009 г.

IMDS rallied Nov 24, 2009. Looks ripe for another correction.

IMDS long range
IMDS day chart
IMDS 5min chart
IMDS made a second big jump in row; the stock seems to fit what Tim Sykes calls Stair Stepper pattern in his educational video -- although he rarely if ever trades stocks this cheap. It's common for such stocks to pull back after such events. It's interesting that in the 5-min chart, the rally is seen to be basically dominated by the first 15 minutes of trading. In the long range chart, the historical highs for IMDS are still way up, while the slow but steady growth in volume looks promising.

вторник, 24 ноября 2009 г.

MCLN, Nov 24, 2009

MCLN day chart
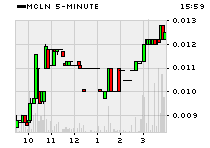
MCLN 5min chart
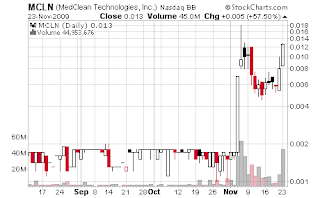
MCLN made another step so I am adding this event to my database of extreme penny-stock events, with day and intra-day charts for future reference and visual learning. Note the intra-day correction which bottomed around 50% of day's gain. The intra-day pattern resembles EOPI and PLMO on their rally days.

пятница, 20 ноября 2009 г.

Tim Sykes' AENY trade, Nov 19, 2009

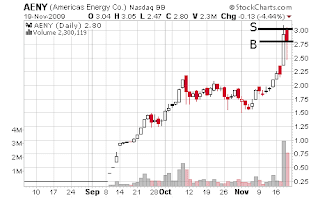
AENY day chart Tim Sykes trade
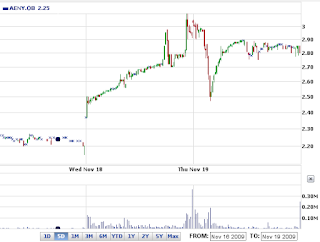
AENY intraday chart
I continue building a database of Tim's trades on the basis of trade log on his site for research and education purposes. What interests me is not so much when exactly the trade was entered intra-day but rather, the longer time scale context in which it was placed. Since selecting trade ideas is the key to success in penny stocks, the goal here is to reconstruct the selection criteria, not the details of trade execution. The trade was closed Nov 19, with buy level at $2.80, sell level at $3.02. According to public data on Tim's site, this is a long trade entered on Nov 18th -- and that's essential to know. It's interesting again at what price level this break-out was bought, and note that even though the next day opened with a gap upward, the stock was sold -- which in this case proved prudent. So again, ignoring technicals when closing the trade once it's profitable is the thing I take home from this trade -- it could be a chance or it could be a time-tested wisdom.

четверг, 19 ноября 2009 г.

Tim Sykes' NLST trade, Nov 18, 2009

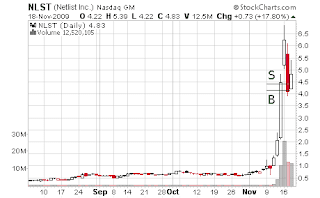
NLST day chart Tim Sykes trade
NLST intraday chart Tim Sykes trade
According to the log on Tim's site, the buy level was $4.16, sell level $4.40. It is interesting that the stock was going up on the day the trade was reported, but Tim's blog makes one feel he approaches the stock with a short bias. Most likely this is a short trade initiated the day before, Nov 17. If so, the trade was closed early the next day's morning which in this case proved prudent. This is an example illustrating how long to wait before entering a short trade -- waiting for the market to prove one's assessment.

Tim Sykes' IMGG trade, Nov 18, 2009

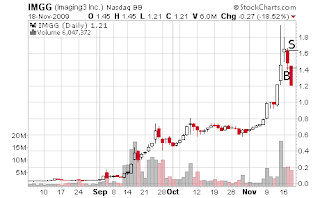
IMGG day chart
IMGG intra-day chart Tim Sykes trade
On TimothySykes.com, this is entered as a winning trade with sell level at $1.64, buy level at $1.42. There is little doubt that this is a short trade, initiated most likely early in the Nov 17th session. The company filed 10-Q on Nov 13, which triggered a rally. The following day it must have looked like the stock ran out of steam. It is interesting that when closing the trade, a powerful technical indicator (an opening with a downward gap) was ignored -- similarly to the way it was done for AWSL. Does ignoring technicals in the short trades begin to look like a feature of Tim's style? Something to be aware of when analyzing future trades.

среда, 18 ноября 2009 г.

Tim Sykes' VRMLQ trade, Nov 13, 2009

VRMLQ Tim Sykes day chart
On Thursday morning, Nov 12, VRMLQ announced a patent news, triggering a rally. It's very interesting that, according to the buy and sell figures reported on his site, Tim entered the rally after or near the technical break-out at $21.50 (sold next day at $22.97). Therefore this looks like a technical long trade in a news-driven context -- unlike his recent EOPI trades which were purely fundamental shorts while technical context was ignored. The balance of technical and fundamental vis-à-vis long and short in this market is a food for thought.

Tim Sykes EONC trade, Nov 11, 2009

EONC chart day
I continue collecting a gallery of Tim Sykes' recent trades so that with time it may become a useful educational tool. As I gather from the blog entries on Tim's site, the stock was shorted on fundamentals (misleading earnings report). The strong conviction explains another short trade in EONC (the first one is found here).

вторник, 17 ноября 2009 г.

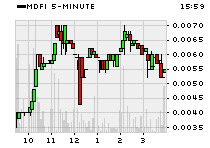
MDFI makes another step, Nov 16, 2009

MDFI day chart
MDFI 5min chart
The news of Medefile's 10-Q became public at 4:27 pm, according to Yahoo. Apparently we are dealing with a news anticipation event. The news itself (which the market did not know) does not seem encouraging as according to the report, the company was losing money faster in Q3 than it did in Q2. However it's hard to tell what the context of trader's expectations for the company is. The numbers do not communicate a sense of an improving business model.

Technically, the 5-min charts shows a lot of volume in the first 10 minutes which apparently triggered the rally. I would not be surprised too see further sales in the stock amid general lack of interest in the coming days.

четверг, 12 ноября 2009 г.

Tim Sykes' EONC trade, Nov 10, 2009

EONC day chart
EONC intra-day

This post is another addition to the gallery of Tim Sykes' trades -- I am trying to reconstruct the logics of his decision-making. Most likely this is a short trade (but strictly speaking, in a complex case like this one can't be 100% sure). If this is a short, then a change in the intra-day trend on Nov 9 and an opening with a gap (down) must have served as a trigger. (Another hint to pay attention to inter-day dynamics). Either way, a difficult trade to execute.

среда, 11 ноября 2009 г.

Link Partners

UpDir

Article and Link Directory 100% Search engine friendly Human Edited Article and Link Directory with Free and Paid Inclusions and Deep Links for Site Links and Articles. Submit your Site now.

Add Url Link to Aloox
Thales Directory
Search-For.Us - Free Web Directory
Used cars for sale
A OK Directory
Business Espana
Affordable Health Insurance Quotes
Global Tsee Directory
Universal Collaboration Web Directory
ArticlesZones Directory - Free General Web Directory
Rakib Khan's Directory
Cool Web Site Listings
Free SEO friendly directory - add you site today!
Free SEO directory. Feel free to add your site, it's free and what more - you can help others find what they are looking for. Publishing the most interesting links and sites on the Internet.
Superior Directory
Hyper Directory
Big Web Directory
Gain Web
Web Directory
SEO and Link Building services
Global Ranking Web Directory

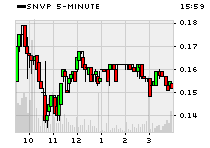
SNVP mania continues, Nov 10, 2009

SNVP day chart
SNVP 5min chart
I must admit I was wrong downplaying the importance of yesterday's gap in SNVP on the basis of intra-day dynamics. (A caveat -- these posts are written from a purely technical standpoint; it's irrelevant whether SNVP is a pump-and-dump, whether this is an oil and gas or cosmetics company, etc.) The stock continued to move higher with the same pattern: a ton of buying in the first 5 minutes of trading, seen in the 5 min chart where the excessive volume within the first 5 min bin is highlighted in red. This looks as if whoever is buying the stock is absent during the business hours and responds to some news received in between the trading sessions. What could explain such a buying pattern? Perhaps the stock is being promoted to some unsophisticated investors is Asia who out of necessity (the time zone difference) find it difficult to participate in real time? If that is the case, the stock may have a long way to go.

If I were to draw a conclusion on the basis of the very limited amount of observations in penny stocks (all of them documented here) I would conclude that one needs to put more weight on the inter-day dynamics (such as gaps between the days) and downplay what happens intra-day.

It seems too risky to short such a stock now, before there is evidence that the mania abates. Even if it abates, a study I recently came across mentions that stocks touted via e-mail spam often fail to return to previous levels due to liquidity being too low to move the price either way once the stimulated interest wanes.

вторник, 10 ноября 2009 г.

SNVP, Nov 9, 2009

SNVP day chart
SNVP 5min chart
A strange-looking event: 1) the last piece of meaningful news on SNVP was issued on Nov 2nd. 2) on Nov 9th, the stock opened with a huge gap and a spike in the volume (see charts) -- this looks as if tons of buy orders were submitted before the opening bell (not something a professional would do) 3) downward dynamics prevailed already in the first 30 min of trading. Kind of makes one think of stock manipulation.

понедельник, 9 ноября 2009 г.

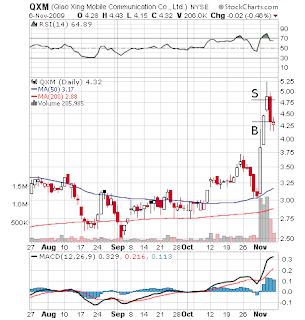
Tim Sykes' QXM short trade, Nov 6, 2009

QXM day Tim Sykes shorts
This is an inter-day short trade. According to Tim's notes on his site, the date of the trade is Nov 6 but judging by the price level (bought at $4.31, sold at $4.80), the stock must have been sold short a day before. That day, Nov 5, was indeed the day stock cracked but Tim's stated sell price indicated that he was part of the action from the very beginning. With no easily found news related to the stock during the time period, this looks like a masterful trade. It is interesting that he has executed a long trade in the same stock just the day before.

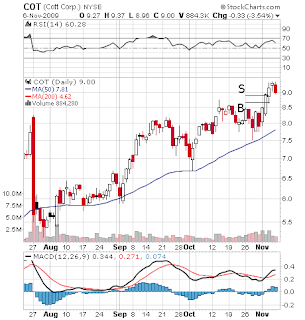
Tim Sykes' COT trade, Nov 4, 2009

COT day Tim Sykes trade
On Nov 4, Cott filed a Material Definitive Agreement form with SEC, following a press-release about the offer of new notes on Nov 3. On Nov 4 one could be wondering whether the news is already priced into the market. Although the volume showed increases, there was nothing dramatic. Apparently Tim has resolved the doubts in favor of the stock, buying at $8.66 and selling at $8.88.

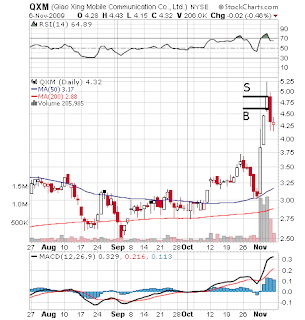
Tim Sykes' QXM trade, Nov 4, 2009

QXM day Tim Sykes trade
I continue recording and researching trades published by Tim Sykes on his site for fun and self-education. QXM was bought on Nov 4 at $4.61 after two consequitive days of openings with gaps, sold on the same day at $4.89. This is one of those numerous cases when the stocks start to "get noticed" for no apparent reason -- I was not able to identify surfacing of "news" related to the company last week when the stock began moving. Checking e-mail spam could be a good idea but I am just beginning my research in how to implement this technically.

Tim Sykes' DDRX trade, Oct 30, 2009

DDRX week chart
DDRX day Tim Sykes trade
For the story behind Diedrich Coffee, read Motley Fool. The big picture of this once penny-stock is illustrated by the week chart. Tim decided to short DDRX on Oct 30 apparently following the news and the technical indications of a crack in the stock the previous days. According to the data on his site, his sell (short-sell) price was $25.70 and the buy (cover) price was $26.53.

пятница, 6 ноября 2009 г.

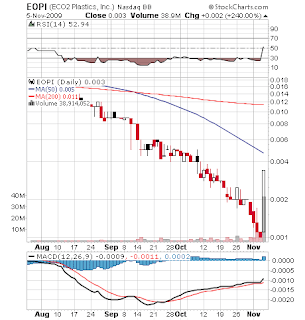
EOPI mystery rally, Nov 5, 2009

EOPI long range
EOPI day chart
EOPI 5min chart
I continue screening for high volume movers in the OTC universe. EOPI's recent pattern on the day scale very much resembles UNCO from two weeks ago. We now know that UNCO continued its downward slide since making a similar jump. Unlike EOPI, UNCO's jump was triggered by news. Unlike UNCO (and like IVOT) here we see a sustained rally throughout the day. Having no clue as to what's going on, it's hard to form rational expectations in this case. The only rationality can be the one of studying market's irrationality. So I am filing this curious case here -- I am not ruling out that the interest in the stock may continue. Again, I would test whether one can proceed with taking next day's opening with a positive gap as an intra-day entry trigger the way it could have worked with IVOT.

IVOT follow-up

IVOT 5min chart
Yesterday IVOT did open with a small gap (0.0041 vs previous close at 0.0040), so my self-imposed condition for maintaining interest in the stock was fulfilled. The stock made a new high in the first 30 minutes of trading then sold off. So the intra-day realistic 20% profit opportunity was there. From the volume however it looks like selling was not heavy; it seems that the majority of people who bought into the momentum on Nov 4th still hold the stock. Speaking of myself, I was about to buy in the first 5 min of trading -- only to realize, after checking my order, that the commission my broker would charge me would be outrageous (since the stock is very cheap, one needs to buy hundreds of thousands of shares or more and the brokers differ in how their fee structure works in such case, in particular with the OTC BB stocks).

So what did I learn? First, my screening the day before with very light analysis did deliver an actionable signal. Second, one needs to think about choosing a broker with the right commission structure for such plays.

четверг, 5 ноября 2009 г.

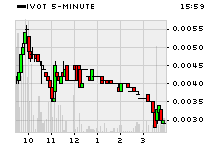
IVOT jumps on big news, sustains the rally through the day, Nov 4, 2009

IVOT long range
IVOT day
IVOT 5 min
IVOT jumped on the news of a distribution agreement with Whirlpool (WHR) for its green product. The magnitude of the event against the backdrop of the last months' lack of action in the stock can be easily gauged from the longer range charts above. What makes the stock different from the likes of UNCO and PLMO (abortive Supernovae) is, besides the sheer size of volume on the day of the jump, its ability to sustain the rally throughout the day. Indeed, the 5 min chart looks different from the pattern of big jump -- big pull-back -- mid-way consolidation, often seen in such cases, in that buying seems to be distributed throughout the day more evenly. It's hard to extrapolate conclusions from the higher frequency time scales to longer range, but if the stock opens with an upward gap today, things may become interesting. Definitely worth watching.

воскресенье, 1 ноября 2009 г.

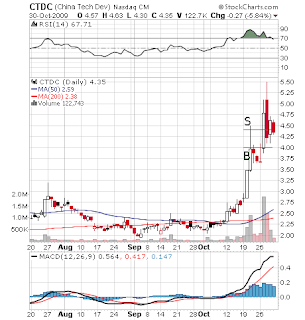
Tim Sykes' CTDC trade, Oct 29, 2009

CTDC day chart Sykes
This looks like a messy but eventually profitable trade. Again, on his site, Tim only gives the date when the trade was closed, which is in this case Oct 29, and the buy and sell levels ($4.00 and $4.42). One can only guess when the trade was enetered. We know for sure the trade was closed on Oct 29.

Tim Sykes' AWSL trade, Oct 26, 2009

AWSL day chart Sykes
On Tim's site, the date of this trade is Oct 26 (Monday), buy price is $3.24, sell price is $4.10. As is seen from the chart, Oct 26 could be the day when the trade was closed but the trade itself must have been entered one or two business days before. On Thursday it must have been clear that the stock gave a crack. One could question the reason for closing the trade the very first thing Monday morning despite the fact that the stock opened with a downward gap, but on the other hand, desire to take profit is understandable in such a situation.

Tim Sykes' RODM trade, Oct 23, 2009

RODM day chart Sykes trade
Here is a trade I found myself scratching a head to explain: a value trade on a penny stock? RODM had an earnings report on Oct 22 which apparently was a disappointment. The next day, the stock opened with the gap and Tim bought it, but apparently the stop loss was so tight that the position was closed with a loss (bought at $5.27, sold at $5.23, according to TimothySykes.com. While a small profit could theoretically be made intra-day on that day, the stop-loss proved beneficial in the long run as the stock kept moving lower. What do we learn? Apparently, an opening with a gap in penny stocks is big enough an indicator to someone with Tim's experience, so it's worth risking a small stake.

Tim Sykes' AMLM trade, Oct 22, 2009

AMLM day chart Sykes
Here is a big move and a successfully executed trade: the trade is listed on Tim's site as an Oct 22 with a "buy" at $2.69 and a "sell" at $2.97 -- most likely he bought the stock the day before and exited the trade on Oct 22. But again, I don't have the intraday data for the stock. A good timing in any case.