Показаны сообщения с ярлыком PINK. Показать все сообщения

вторник, 12 января 2010 г.

Tim Sykes' AWSL trade, Jan 4, 2010

AWSL day chart Sykes trade
In this case the direction of Tim's trade is unambiguous from the chart. I am less sure about when the trade was entered. The sell price given in Tim's log is $3.35; on Dec 31, the stock traded between $3.32 (open and high) and $3.27 (close and low). Most likely selling short for $3.35 was impossible on Dec.31. It was also impossible on Dec. 30, but could be possible on Dec. 29 -- in that case, a break-down from the tight range of the previous 8 days (with a higher volume) must have been the signal.

понедельник, 11 января 2010 г.

Tim Sykes' VRMLQ trade, Dec 30, 2009


Tim's previous VRMLQ trades were long trades joining well established rallies after they became well established. This trade is no exception. According to the data on Tim's site, the stock was bought at $26.50, sold at $27.60. Most likely the stock was bought the previous day. With the benefit of hindsight, this looks more like a multi-day short opportunity. My feeling so far is that instances of stocks going Supernova are impressive but rare, while corrections after spikes are commonplace.

среда, 23 декабря 2009 г.

Tim Sykes' IFNY trade, Dec 21, 2009

IFNY day chart Tim Sykes trade
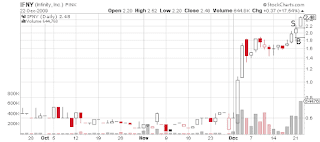
This is Tim's second trade in this stock in December (see the previous one). Again not sure whether this is a long or short, but judging from the posts on his site (responses from TimAlert subscribers) the sentiment was bullish this time, and the trade idea was out already on Friday. Tim bought at $1.85, sold at $2.17 -- a profitable trade.

понедельник, 21 декабря 2009 г.

Tim Sykes' IFNY trade, Dec 7, 2009

IFNY day chart Tim Sykes trade

This is one of those trades where one misses the intra-day data -- the scale of the trade (both time- and dollar-wise) looks lost in the chart. Judging from Tim's comments on his site, this was a short. Sold short at $1.50, bought to cover at $1.47. Nevertheless, the context in which the trade was placed is clear -- it is also clear after the fact that one should have been buying. But Tim managed to extract a bit of a profit out of this trade.

среда, 18 ноября 2009 г.

Tim Sykes' VRMLQ trade, Nov 13, 2009

VRMLQ Tim Sykes day chart
On Thursday morning, Nov 12, VRMLQ announced a patent news, triggering a rally. It's very interesting that, according to the buy and sell figures reported on his site, Tim entered the rally after or near the technical break-out at $21.50 (sold next day at $22.97). Therefore this looks like a technical long trade in a news-driven context -- unlike his recent EOPI trades which were purely fundamental shorts while technical context was ignored. The balance of technical and fundamental vis-à-vis long and short in this market is a food for thought.

воскресенье, 1 ноября 2009 г.

Tim Sykes' AWSL trade, Oct 26, 2009

AWSL day chart Sykes
On Tim's site, the date of this trade is Oct 26 (Monday), buy price is $3.24, sell price is $4.10. As is seen from the chart, Oct 26 could be the day when the trade was closed but the trade itself must have been entered one or two business days before. On Thursday it must have been clear that the stock gave a crack. One could question the reason for closing the trade the very first thing Monday morning despite the fact that the stock opened with a downward gap, but on the other hand, desire to take profit is understandable in such a situation.

суббота, 17 октября 2009 г.

Tim Sykes' VRMLQ trade, Oct 16, 2009

VRMLQ chart
The trade is listed on Tim's site with the "buy" at $16.79 and "sell" at $18.65. Stock's day's Range on Oct 16 according to Yahoo! was 17.30 - 19.29; so the entry point must have been Oct 15. Apparently the stock's opening with a gap on Oct 15 served as a buy signal. Volume on the contrary seems not particularly informative.

You need logarithmic scale to see the levels from which the stock rose in a matter of a few weeks:

VRMLQ linear scale

Sure enough on Sept 11 I would call this stock a Supernova candidate, but its dynamics so far is very robust -- looks more robust and sustainable than most Supernova candidates. So far this is the first Supernova-like stock discussed in this blog where after the day of the initial explosion, the stock gapped up on the next trading day. Typically they pull back next day.

воскресенье, 11 октября 2009 г.

Tim Sykes' GBVP trade Oct 7, 2009

GVBP chart SEC suspended trading in GBVP on Sept 23, 2009 till 11:59 pm Oct 6, 2009, see their press release. On the TimothySykes.com web site, this profitable trade is assigned to Oct 7, thus the short position was covered the first business day on which the trading was resumed. It is amazing that the stock jumped up on that day. The stock is said to be sold at $0.27 which most likely occured on Oct 21. At that point, the technical trend was well established. Again a red candle coupled with a spike in the volume on Oct 16 signalled a trend break down.

Tim Sykes' EMGE trade, Sept 28, 2009

EMGE chart
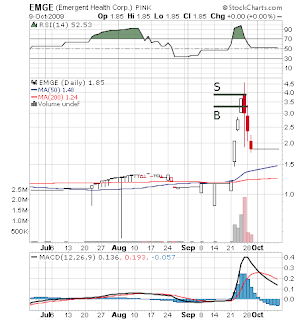
This looks like a perfect intra-day short trade. According to info on the TimothySykes.com web site, Tim sold EMGE at $3.13, covered at $2.16. This was a little risk trade, unlike the previous day's, since one could rely on an established bearish trend.

Tim Sykes' EMGE trade, Sept 25, 2009

EMGE chart
This is a winning trade on EMGE, most likely a short trade-- the stock was down on the day. According to info on TimothySykes.com, Tim sold at $3.88 and covered at $3.20. Looking at the chart, a red candle in combination with an increase in volume provides a very strong bearish indicator, but when the trade was placed, it was not clear what the final volume for the day would be. The trade was entered and exited on the very day the previously bullish trend broke down and the decision to sell short must have been based on intra-day indicators and/or fundamental data.

суббота, 10 октября 2009 г.

Tim Sykes' GVBP trade, Sept 21, 2009


A successful short trade. The trade info on TimothySykes.com assigns the trade to September 21 with "buy" at $0.29, "sell" at $0.49. But he couldn't have sold at $0.49 on September 21 -- that's outside the day's range. Apparently he sold short on the previous day and covered at $0.29.

The watershed between bullish and bearish sentiment on GVBP is clearly seen in the chart: that's September 16th, the first day when a downward (red) candle is combined with a rise in the volume. After that, the bearish trend continues while volume goes down. This pattern is already well formed by the time Tim enters his short trade.

Tim Sykes' GVBP trade, Sept 15, 2009


A loss on what could have been a momentum trade. According to the info on TimothySykes.com, Tim bought at $0.615, sold at $0.42. This is Tim's only trade in this stock since Sept 9, so one is left to wonder why not enter earlier. The B and S levels in the drawing are not precise.