Показаны сообщения с ярлыком stair-stepper. Показать все сообщения

среда, 20 января 2010 г.

Tim Sykes' PEIX trade, Jan 14, 2010

PEIX day chart Sykes trade
This is a bet on the continued downward trend in PEIX after the convincing move down the day before and an opening with a gap down. According to Tim's log, he sold at $2.05, bought (to cover) at $1.96. Tim was able to time it accurately on the way up as well as down.


PEIX chart 3 months of day data
By the way, the longer time-frame chart puts the stock into the stair-stepper category.

среда, 25 ноября 2009 г.

IMDS rallied Nov 24, 2009. Looks ripe for another correction.

IMDS long range
IMDS day chart
IMDS 5min chart
IMDS made a second big jump in row; the stock seems to fit what Tim Sykes calls Stair Stepper pattern in his educational video -- although he rarely if ever trades stocks this cheap. It's common for such stocks to pull back after such events. It's interesting that in the 5-min chart, the rally is seen to be basically dominated by the first 15 minutes of trading. In the long range chart, the historical highs for IMDS are still way up, while the slow but steady growth in volume looks promising.

вторник, 24 ноября 2009 г.

MCLN, Nov 24, 2009

MCLN day chart
MCLN 5min chart
MCLN made another step so I am adding this event to my database of extreme penny-stock events, with day and intra-day charts for future reference and visual learning. Note the intra-day correction which bottomed around 50% of day's gain. The intra-day pattern resembles EOPI and PLMO on their rally days.

вторник, 17 ноября 2009 г.

MDFI makes another step, Nov 16, 2009

MDFI day chart
MDFI 5min chart
The news of Medefile's 10-Q became public at 4:27 pm, according to Yahoo. Apparently we are dealing with a news anticipation event. The news itself (which the market did not know) does not seem encouraging as according to the report, the company was losing money faster in Q3 than it did in Q2. However it's hard to tell what the context of trader's expectations for the company is. The numbers do not communicate a sense of an improving business model.

Technically, the 5-min charts shows a lot of volume in the first 10 minutes which apparently triggered the rally. I would not be surprised too see further sales in the stock amid general lack of interest in the coming days.

воскресенье, 1 ноября 2009 г.

Tim Sykes USEG trade, Oct 22, 2009

USEG day chart Sykes
As you see in the immediate history of the stock, what it did a couple of times was making a big step upwards, then taking a breather for three or four days, then making another big step. This is what Tim calls stair-stepper in his educational materials. According to the info on the same site, Tim bought at $6.12 and sold at $6.09 -- a small loss. Typically, such stock develop flag formations and it's hard to predict the next big step. It seems you can only be sure once you are inside the big step, which is something you can in principle detect intra-day by a combination of large price and volume jumps.

среда, 14 октября 2009 г.

IMDS on Oct 13, 2009: watching the action

After seeing the IMDS action on the day before, Oct 12, I said in a private communication that I expected the stock to consolidate between 0.02 and 0.03 and then to perhaps make another jump a few days later. So far I am right, here is the IMDS chart up to and including Oct 13:

IMDS chart Oct 13, 2009

This type of pattern puts IMDS into the "stair-stepper" class. The intra-day (5 min) chart below shows what happened yesterday:
IMDS 5 min chart Oct 13

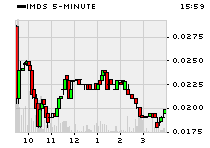
The first few minutes after the opening bell were fun to watch, with traders running in droves to sell the stock. I don't know how many people were taking profit and how many were trying to short the stock, but the price action was quite predictable. When the stock hit the 0.02 level (losing 1/3 off the previous day's close) my brain told me I should buy it -- but I did not trust this voice and did nothing on that day. About 10% of day's trading volume was made in the first five minutes. You can see volume dying off in the intra-day chart.