Показаны сообщения с ярлыком penny stock. Показать все сообщения

суббота, 27 февраля 2010 г.

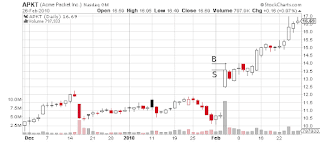
Tim Sykes' APKT trade, Feb 3, 2010

APKT day chart
Here I am puzzled: this was bought as a 1st day break-out, but it was pretty clear to be a break-out from the very beginning of the day, so why wait until $13.96 to buy? Tim sold APKT with a loss at $13.58 later in the day.

Tim Sykes' CNLG trade, Feb 1, 2010

CNLG day chart
The stock was sold short as a pump&dump, and you would not be able to tell that from this chart -- need a finer scale data. What is remarkable here is the fact that Tim sold the stock short on the day of a huge break-out. Certainly if there is a technical side to this trade, it does not lie on the day scale. A profitable trade for Tim, he sold short at $4.30, covered at $4.19, according to the log kept on his site.

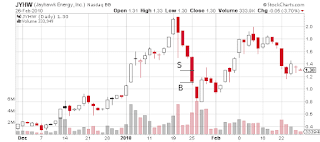
Tim Sykes' JYHW trade, Jan 27, 2010

JYHW day chart
Japanese candlestick pattern known as handing man started this very strong downward trend which lasted for six consecutive days, coming to climax on January 26 -- a belt-hold line day which, despite a downward gap at the opening and an increased volume, failed to accelerate the price decay. Tim went short on the fourth day of this powerful trend. According to the log on his site, he sold at $1.28, covered at $1.10.

Tim Sykes' AENY trade, Jan 25, 2010

AENY day chart
This trade must have been a frustrating experience: the stock showed a strong performance the day before; most likely Tim bought near the beginning of the day (the buy price, $4.55 is very close to the price at open, $4.54). The stock went as high as $4.90, but Tim never took profit and eventually sold at $4.27.

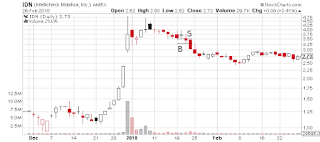
Tim Sykes' IDN trade, Jan 22, 2010

IDN day chart
The stock must have been sold short on the previous day, Jan 21, the day with the downside gap at the opening. Covered at or near the previous day's low, although the stock kept moving lower. Speaking of volume, both days look unremarkable. Data from Tim's log at his site: sold at $3.50, covered at $3.28.

пятница, 12 февраля 2010 г.

Tim Sykes' ICXT trade, Jan 22, 2010

ICXT day chart Tim Sykes
According to Tim's log entry on his site, the stock was sold (short) at $7.53, covered at $7.33. According to Tim's comments, $7.50 was an important level technically. The $7.33 price does not seem to belong to January 22 though; it's possible that he covered next day or that he covered on January 22 and next day, with average price being $7.33. It's interesting that speaking of volume, there is nothing special about January 22.

среда, 10 февраля 2010 г.

Tim Sykes' CDII trade, Jan 21, 2010

CDII day chart Tim Sykes trade
Tim keeps shorting CDII based on fundamental conviction, and this time possibly adding the fact that the previous day was a relatively strong downward move coupled with an up-tick in volume. This is the second CDII trade I record (here is the first one). He sold short at $2.14, covered at $2.16.

Catching up with Tim Sykes: MDCE, January 19, 2010

MDCE Tim Sykes trade
Mid-day turn-around pattern. The stock was sold short at $0.43, bought back at $0.34.

среда, 20 января 2010 г.

Tim Sykes' PEIX trade, Jan 14, 2010

PEIX day chart Sykes trade
This is a bet on the continued downward trend in PEIX after the convincing move down the day before and an opening with a gap down. According to Tim's log, he sold at $2.05, bought (to cover) at $1.96. Tim was able to time it accurately on the way up as well as down.


PEIX chart 3 months of day data
By the way, the longer time-frame chart puts the stock into the stair-stepper category.

вторник, 19 января 2010 г.

Tim Sykes' PEIX trade, Jan 13, 2010

PEIX day chart Sykes trade
Predictably, this was a short. The stock had had 4 consecutive days of strong gains. According to Tim's log, the stock was sold at $2.27, covered at $2.19.

Tim Sykes' PEIX trade, Jan 12, 2010

PEIX day chart Sykes trade
I understand this was a long, based on strong momentum. Buy the way here a reduction in volume on January 12 is followed by a red candlestick next day. By the way Tim's fraction of the price action (bought at $2.31, sold at $2.35) looks tiny in comparison with the stock moves.

Tim Sykes' LUNA trade, Jan 11, 2010

LUNA day chart Sykes trade
This is interesting -- I understand that this was a buy, based on a break-out, but Tim's sell price of $4.78 just does not fit into any of the days prior to January 11. The trade is entered into Tim's log, dated as January 11, with the buy price of $3.36. Tim's comments indicate that the stock was sold in the premarket trading.

пятница, 15 января 2010 г.

Tim Sykes' JYHW trade, Jan 8, 2010

JYHW day chart showing Sykes trade
So I gather this stock was shorted because it was being pumped openly -- by the way this was done, as it happens, with explicit disclaimers: alas, attention spans get shorter and shorter, people do not read the disclaimers. As far as the chart goes, yes there was some selling pressure on Jan 7 but the stock ended the day about where it has began -- it's a doji candle. If one could short these stocks just because somebody paid to promote them, life would have been way too easy. According to his log, Tim sold at $1.41 and had to buy at $1.50.
Tim Sykes' CDII trade, Jan 8, 2010

CDII day chart Sykes trade
This Tim's trade must have been an unsuccessful short trade. In the log on his site, he has dated the trade by Jan 8, with the buy level at $2.24, sell level at $2.12 -- so this was a loss. Now the $2.12 does not fall into Jan 8th range, therefore I conclude this was a short sale made on one of the previous days -- most likely, Jan 7th. It looks like his reasons to short were more fundamental than technical: the stock did not crack on Jan 7th.

четверг, 14 января 2010 г.

Tim Sykes' AHD trade, Jan 7, 2010

AHD day chart Sykes trade

This trade is entered in Tim's log as January 7th, but the actual trade must have taken place the day before. With the buy level $7.15, sell level at $7.01, this trade was a loss. On the day chart, Jan 6th candle certainly does not look bullish and moreover, the $7.15 number is clearly out of Jan 7th day range.

Tim Sykes' AENY trade, Jan 6, 2010

AENY day chart Sykes trade
Another short trade on AENY. The way it is entered in Tim's log (sell at $4.66, buy at $4.31), looks like he was entering the short trades the day before just as he must have been covering the older short trades in the same stock (?). On Jan 6, day's high in AENY was $4.55.

вторник, 12 января 2010 г.

Tim Sykes' AENY trade, Jan 5, 2010

AENY day chart Sykes trade
This looks similar to Tim's IDN trade the day before: the turn-around can be identified in the day chart pattern. He seems to have been able to cover almost at the day's bottom. According to his site, his sell price was $4.71, buy price $4.19.

Tim Sykes' IDN trade, Jan 5, 2010

IDN day chart Sykes trade
The direction of this profitable trade is hard to tell from the chart -- in fact according to the chart one could have made money trading this stock either way that day. I am pretty sure Tim's intention was to continue shorting, following a successful short the previous day. In fact this turned out to be the day stock turned around and continued rallying. Tim's sell price was $3.56, buy price $3.48.

Tim Sykes' IDN trade, Jan 4, 2010

IDN day chart Sykes trade
Here I think I get the trade idea from the progression of the day candles: the day the short trade was entered must have been the first day with high significantly exceeding close (Dec 31, a local turning point) or the next one. Tim sold short at $3.90, covered at $3.57.

Tim Sykes' AWSL trade, Jan 4, 2010

AWSL day chart Sykes trade
In this case the direction of Tim's trade is unambiguous from the chart. I am less sure about when the trade was entered. The sell price given in Tim's log is $3.35; on Dec 31, the stock traded between $3.32 (open and high) and $3.27 (close and low). Most likely selling short for $3.35 was impossible on Dec.31. It was also impossible on Dec. 30, but could be possible on Dec. 29 -- in that case, a break-down from the tight range of the previous 8 days (with a higher volume) must have been the signal.