Показаны сообщения с ярлыком Supernova candidate. Показать все сообщения

среда, 11 ноября 2009 г.

SNVP mania continues, Nov 10, 2009

SNVP day chart
SNVP 5min chart
I must admit I was wrong downplaying the importance of yesterday's gap in SNVP on the basis of intra-day dynamics. (A caveat -- these posts are written from a purely technical standpoint; it's irrelevant whether SNVP is a pump-and-dump, whether this is an oil and gas or cosmetics company, etc.) The stock continued to move higher with the same pattern: a ton of buying in the first 5 minutes of trading, seen in the 5 min chart where the excessive volume within the first 5 min bin is highlighted in red. This looks as if whoever is buying the stock is absent during the business hours and responds to some news received in between the trading sessions. What could explain such a buying pattern? Perhaps the stock is being promoted to some unsophisticated investors is Asia who out of necessity (the time zone difference) find it difficult to participate in real time? If that is the case, the stock may have a long way to go.

If I were to draw a conclusion on the basis of the very limited amount of observations in penny stocks (all of them documented here) I would conclude that one needs to put more weight on the inter-day dynamics (such as gaps between the days) and downplay what happens intra-day.

It seems too risky to short such a stock now, before there is evidence that the mania abates. Even if it abates, a study I recently came across mentions that stocks touted via e-mail spam often fail to return to previous levels due to liquidity being too low to move the price either way once the stimulated interest wanes.

пятница, 6 ноября 2009 г.

EOPI mystery rally, Nov 5, 2009

EOPI long range
EOPI day chart
EOPI 5min chart
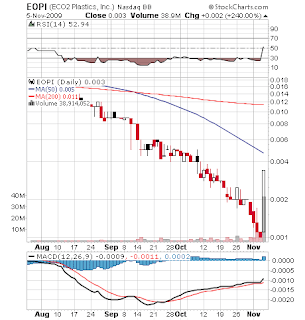
I continue screening for high volume movers in the OTC universe. EOPI's recent pattern on the day scale very much resembles UNCO from two weeks ago. We now know that UNCO continued its downward slide since making a similar jump. Unlike EOPI, UNCO's jump was triggered by news. Unlike UNCO (and like IVOT) here we see a sustained rally throughout the day. Having no clue as to what's going on, it's hard to form rational expectations in this case. The only rationality can be the one of studying market's irrationality. So I am filing this curious case here -- I am not ruling out that the interest in the stock may continue. Again, I would test whether one can proceed with taking next day's opening with a positive gap as an intra-day entry trigger the way it could have worked with IVOT.

четверг, 5 ноября 2009 г.

IVOT jumps on big news, sustains the rally through the day, Nov 4, 2009

IVOT long range
IVOT day
IVOT 5 min
IVOT jumped on the news of a distribution agreement with Whirlpool (WHR) for its green product. The magnitude of the event against the backdrop of the last months' lack of action in the stock can be easily gauged from the longer range charts above. What makes the stock different from the likes of UNCO and PLMO (abortive Supernovae) is, besides the sheer size of volume on the day of the jump, its ability to sustain the rally throughout the day. Indeed, the 5 min chart looks different from the pattern of big jump -- big pull-back -- mid-way consolidation, often seen in such cases, in that buying seems to be distributed throughout the day more evenly. It's hard to extrapolate conclusions from the higher frequency time scales to longer range, but if the stock opens with an upward gap today, things may become interesting. Definitely worth watching.

пятница, 30 октября 2009 г.

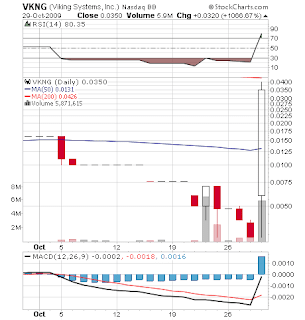
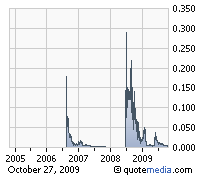
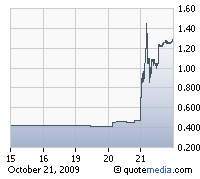
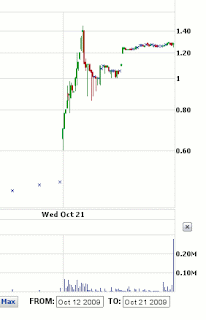
VKNG on Oct 29, 2009: provoking hopes of a come-back

VKNG long range
VKNG day chart
VKNG 5min chart
The picture here resembles UNCO: the stock has seen better times, has been in a steady decline, then comes this sudden jump in price. Unlike UNCO, there is no news and judging by the 5min chart, the rise in price is somewhat more gradual. After hitting the resistance at 0.04, the stock pulls back -- this is seen very frequently in such cases. The 5min chart looks somewhat similar to BPMA with similar volume and similar lack of news. As we now know, BPMA went nowhere after the event.

среда, 28 октября 2009 г.

Serial Supernova UNCO rallies on news, Oct 27, 2009

UNCO 5 year history
UNCO day
UNCO 5min chart
The Serial Supernova status of this stock is confirmed by the five year history chart, top panel. The news announcement (approval for construction of new tailings pond at the Deer Trail Mine) hit the wire at 10:42 am. What followed and how significant it was can be seen from the day and 5-minute charts. Does the 5-minute chart look familiar? It certainly does if you looked at the similar PLMO and MYNG events.

The stock takes off at 0.0030, hits resistance at 0.0060 and then settles down at 0.0045 -- the factors of 2 work their magic. I wish it were so easy in other markets.

четверг, 22 октября 2009 г.

Pulmo Biotech, PLMO rallies after two announcements

PLMO long range chartPLMO chart
PLMO intraday chart

The first announcement was made Oct 20 at 4:10pm and the second, Oct 21 at 4:10pm (see Yahoo! PLMO headlines for more details). For the purpose of these technical analysis posts, it does not matter what exactly the positive news was. Apparently the stock rally on Oct 21 which began with a gap opening for the stock, was triggered entirely by the first announcement. Here as in other similar cases, you have a very clean environment to study market response to an isolated stimulus which is a perfectly localized excitation. The intraday chart looks somewhat similar to MING.

среда, 21 октября 2009 г.

Oct 20, 2009: BPMA rallies with no news

BPMA long range
BPMA day
BPMA intraday


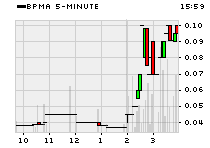
Yesterday BPMA had a moderate size rally with no news to explain it. The event is seen as a sharp spike in both price and volume.

I keep archiving penny-stock explosive events with the vision that such a gallery will prove helpful in creating an automated trigger for such events. I am interested to know how such easily detectable events change the odds in the subsequent history of the stock. Do they make it more likely for the stock to go up next day? To go down? So far there is no conclusive answer but the good news is that such events happen at the rate of the order of once a day which means that in a few months one will be able to speak about some probability estimates with a few percent accuracy.

Oct 20, 2009: NEOM rallies on settlement news

NEOM day
NEOM intraday
Here is another penny-stock that fits my Supernova-candidate profile: NEOM rallied on the news of a settlement and license agreement with Scanbury Inc. The price had a 60% spike as the volume exceeded 200M shares. As the day chart above shows, NEOM may be a turnaround story. The news appeared on Business Wire at 2:09pm EDT -- as the intraday chart shows, a very robust rally was fully underway at that time. So these stocks need to be traded on technical indicators which in this case would have been fairly unambiguous.

пятница, 16 октября 2009 г.

The MDFI rally of Oct 15, 2009

MDFI long range
MDFI day scale
MDFI intra-day

The long-range chart shows that even at the present $0.0045 level, MDFI is only a shade of its former $0.035 glory. (Like in astrophysics, you operate with orders of magnitude in this Supernova business). The day chart shows that it's quite possible to set up an automated trigger on the basis of combined volume and price gains which would put you on the bandwagon in the later stage of the intra-day rally while having a very high signal to noise ratio -- in other words, the percentage of false starts following such a trigger would be low. The long-range chart confirms the impression -- the vacuum of action in 2009 lasted for months.

среда, 14 октября 2009 г.

MYNG was another big gainer on Oct 13, 2009

MING chart day
MYNG chart 5 min Oct 13, 2009
The mining company received a buy offer for a piece of property from another company. On the intra-day chart, you can see exactly when this happened and how long it took for the price to adjust to the new level. Magically, this new level (0.003), just as the one that served as a resistance (0.004), are round figures. The whole adjustment process took about 2 hours. So here is market efficiency in action, with an estimate for the characteristic time scale. It is not instantaneous.

I am curious what will happen today: some people do not digest information on an hourly basis, but do it on a daily basis. For them, MYNG is still "in the news".

IMDS on Oct 13, 2009: watching the action

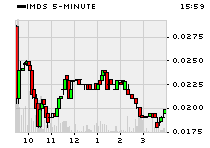
After seeing the IMDS action on the day before, Oct 12, I said in a private communication that I expected the stock to consolidate between 0.02 and 0.03 and then to perhaps make another jump a few days later. So far I am right, here is the IMDS chart up to and including Oct 13:

IMDS chart Oct 13, 2009

This type of pattern puts IMDS into the "stair-stepper" class. The intra-day (5 min) chart below shows what happened yesterday:
IMDS 5 min chart Oct 13

The first few minutes after the opening bell were fun to watch, with traders running in droves to sell the stock. I don't know how many people were taking profit and how many were trying to short the stock, but the price action was quite predictable. When the stock hit the 0.02 level (losing 1/3 off the previous day's close) my brain told me I should buy it -- but I did not trust this voice and did nothing on that day. About 10% of day's trading volume was made in the first five minutes. You can see volume dying off in the intra-day chart.