Показаны сообщения с ярлыком NASDAQ BB. Показать все сообщения

суббота, 27 февраля 2010 г.

Tim Sykes' JYHW trade, Jan 27, 2010

JYHW day chart
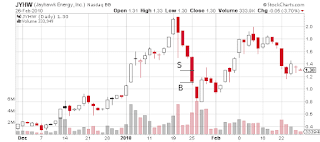
Japanese candlestick pattern known as handing man started this very strong downward trend which lasted for six consecutive days, coming to climax on January 26 -- a belt-hold line day which, despite a downward gap at the opening and an increased volume, failed to accelerate the price decay. Tim went short on the fourth day of this powerful trend. According to the log on his site, he sold at $1.28, covered at $1.10.

Tim Sykes' AENY trade, Jan 25, 2010

AENY day chart
This trade must have been a frustrating experience: the stock showed a strong performance the day before; most likely Tim bought near the beginning of the day (the buy price, $4.55 is very close to the price at open, $4.54). The stock went as high as $4.90, but Tim never took profit and eventually sold at $4.27.

среда, 10 февраля 2010 г.

Catching up with Tim Sykes: MDCE, January 19, 2010

MDCE Tim Sykes trade
Mid-day turn-around pattern. The stock was sold short at $0.43, bought back at $0.34.

пятница, 15 января 2010 г.

Tim Sykes' JYHW trade, Jan 8, 2010

JYHW day chart showing Sykes trade
So I gather this stock was shorted because it was being pumped openly -- by the way this was done, as it happens, with explicit disclaimers: alas, attention spans get shorter and shorter, people do not read the disclaimers. As far as the chart goes, yes there was some selling pressure on Jan 7 but the stock ended the day about where it has began -- it's a doji candle. If one could short these stocks just because somebody paid to promote them, life would have been way too easy. According to his log, Tim sold at $1.41 and had to buy at $1.50.

четверг, 14 января 2010 г.

Tim Sykes' AENY trade, Jan 6, 2010

AENY day chart Sykes trade
Another short trade on AENY. The way it is entered in Tim's log (sell at $4.66, buy at $4.31), looks like he was entering the short trades the day before just as he must have been covering the older short trades in the same stock (?). On Jan 6, day's high in AENY was $4.55.

вторник, 12 января 2010 г.

Tim Sykes' AENY trade, Jan 5, 2010

AENY day chart Sykes trade
This looks similar to Tim's IDN trade the day before: the turn-around can be identified in the day chart pattern. He seems to have been able to cover almost at the day's bottom. According to his site, his sell price was $4.71, buy price $4.19.

среда, 25 ноября 2009 г.

IMDS rallied Nov 24, 2009. Looks ripe for another correction.

IMDS long range
IMDS day chart
IMDS 5min chart
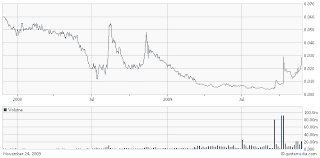
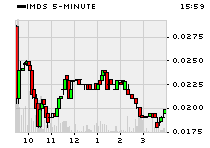
IMDS made a second big jump in row; the stock seems to fit what Tim Sykes calls Stair Stepper pattern in his educational video -- although he rarely if ever trades stocks this cheap. It's common for such stocks to pull back after such events. It's interesting that in the 5-min chart, the rally is seen to be basically dominated by the first 15 minutes of trading. In the long range chart, the historical highs for IMDS are still way up, while the slow but steady growth in volume looks promising.

вторник, 24 ноября 2009 г.

MCLN, Nov 24, 2009

MCLN day chart
MCLN 5min chart
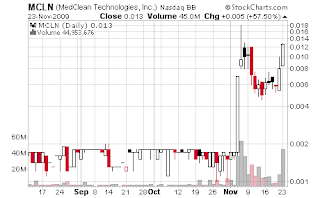
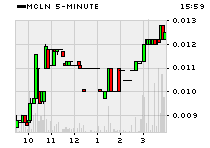
MCLN made another step so I am adding this event to my database of extreme penny-stock events, with day and intra-day charts for future reference and visual learning. Note the intra-day correction which bottomed around 50% of day's gain. The intra-day pattern resembles EOPI and PLMO on their rally days.

четверг, 19 ноября 2009 г.

Tim Sykes' IMGG trade, Nov 18, 2009

IMGG day chart
IMGG intra-day chart Tim Sykes trade
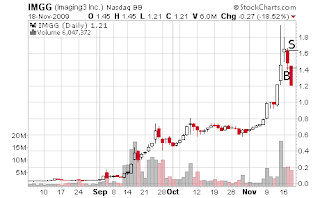
On TimothySykes.com, this is entered as a winning trade with sell level at $1.64, buy level at $1.42. There is little doubt that this is a short trade, initiated most likely early in the Nov 17th session. The company filed 10-Q on Nov 13, which triggered a rally. The following day it must have looked like the stock ran out of steam. It is interesting that when closing the trade, a powerful technical indicator (an opening with a downward gap) was ignored -- similarly to the way it was done for AWSL. Does ignoring technicals in the short trades begin to look like a feature of Tim's style? Something to be aware of when analyzing future trades.

вторник, 17 ноября 2009 г.

MDFI makes another step, Nov 16, 2009

MDFI day chart
MDFI 5min chart
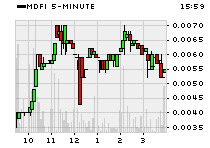
The news of Medefile's 10-Q became public at 4:27 pm, according to Yahoo. Apparently we are dealing with a news anticipation event. The news itself (which the market did not know) does not seem encouraging as according to the report, the company was losing money faster in Q3 than it did in Q2. However it's hard to tell what the context of trader's expectations for the company is. The numbers do not communicate a sense of an improving business model.

Technically, the 5-min charts shows a lot of volume in the first 10 minutes which apparently triggered the rally. I would not be surprised too see further sales in the stock amid general lack of interest in the coming days.

среда, 11 ноября 2009 г.

SNVP mania continues, Nov 10, 2009

SNVP day chart
SNVP 5min chart
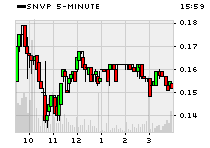
I must admit I was wrong downplaying the importance of yesterday's gap in SNVP on the basis of intra-day dynamics. (A caveat -- these posts are written from a purely technical standpoint; it's irrelevant whether SNVP is a pump-and-dump, whether this is an oil and gas or cosmetics company, etc.) The stock continued to move higher with the same pattern: a ton of buying in the first 5 minutes of trading, seen in the 5 min chart where the excessive volume within the first 5 min bin is highlighted in red. This looks as if whoever is buying the stock is absent during the business hours and responds to some news received in between the trading sessions. What could explain such a buying pattern? Perhaps the stock is being promoted to some unsophisticated investors is Asia who out of necessity (the time zone difference) find it difficult to participate in real time? If that is the case, the stock may have a long way to go.

If I were to draw a conclusion on the basis of the very limited amount of observations in penny stocks (all of them documented here) I would conclude that one needs to put more weight on the inter-day dynamics (such as gaps between the days) and downplay what happens intra-day.

It seems too risky to short such a stock now, before there is evidence that the mania abates. Even if it abates, a study I recently came across mentions that stocks touted via e-mail spam often fail to return to previous levels due to liquidity being too low to move the price either way once the stimulated interest wanes.
вторник, 10 ноября 2009 г.

SNVP, Nov 9, 2009

SNVP day chart
SNVP 5min chart
A strange-looking event: 1) the last piece of meaningful news on SNVP was issued on Nov 2nd. 2) on Nov 9th, the stock opened with a huge gap and a spike in the volume (see charts) -- this looks as if tons of buy orders were submitted before the opening bell (not something a professional would do) 3) downward dynamics prevailed already in the first 30 min of trading. Kind of makes one think of stock manipulation.

воскресенье, 1 ноября 2009 г.

Tim Sykes' AMLM trade, Oct 22, 2009

AMLM day chart Sykes
Here is a big move and a successfully executed trade: the trade is listed on Tim's site as an Oct 22 with a "buy" at $2.69 and a "sell" at $2.97 -- most likely he bought the stock the day before and exited the trade on Oct 22. But again, I don't have the intraday data for the stock. A good timing in any case.

четверг, 15 октября 2009 г.

Tim Sykes' NPHC trade, Oct 13, 2009

NPHC chart
Here is another amazing short trade. On Tim's site, the trade is entered under October 13 with the "buy" price of $0.59 and "sell" price of $0.71. Looking at the chart, he must have entered the trade on October 12 and kept it overnight. Not sure how he timed the entry. Clearly the stock had a string of bad days in late September--early October while the volume was in decline; there was a new two-week low on a volume spike on October 2, but that's all I can say from the chart alone.

Tim Sykes' IMGG trade, Oct 12, 2009

IMGG chart
On TimothySykes.com, this is entered as a winning trade with buy level $0.60, sell level $0.70. On the chart, this looks like a very well timed short-sell trade. The trade was placed on a second down day after a series of daily gains for the stock.

среда, 14 октября 2009 г.

IMDS on Oct 13, 2009: watching the action

After seeing the IMDS action on the day before, Oct 12, I said in a private communication that I expected the stock to consolidate between 0.02 and 0.03 and then to perhaps make another jump a few days later. So far I am right, here is the IMDS chart up to and including Oct 13:

IMDS chart Oct 13, 2009

This type of pattern puts IMDS into the "stair-stepper" class. The intra-day (5 min) chart below shows what happened yesterday:
IMDS 5 min chart Oct 13

The first few minutes after the opening bell were fun to watch, with traders running in droves to sell the stock. I don't know how many people were taking profit and how many were trying to short the stock, but the price action was quite predictable. When the stock hit the 0.02 level (losing 1/3 off the previous day's close) my brain told me I should buy it -- but I did not trust this voice and did nothing on that day. About 10% of day's trading volume was made in the first five minutes. You can see volume dying off in the intra-day chart.

воскресенье, 11 октября 2009 г.

Tim Sykes' ZAGG trade, Oct 9, 2009

ZAGG chart
On Oct 9, an up-tick in ZAGG price and volume took place and Tim took advantage of it with this trade. It is interesting that the event was not quite sudden: increases in volume had been seen for the previous three trading days. Tim entered the trade after the break-out from the range-bound channel became a fact. The trade was closed with a nice profit next day, Oct 10.

Tim Sykes' NPHC trade, Oct 1, 2009

NPHC chart
On TimothySykes.com, this trade is dated by Oct 1 with the buy level at $0.70, sell level at $0.85. Apparently the stock was shorted on the previous day. It is not clear what served as an immediate trigger to enter this profitable trade, although Tim was very sceptical on the company, see this post.

суббота, 10 октября 2009 г.

Tim Sykes GFGU trade Sept 9, 2009


This is a recent Tim Sykes trade, researched on the basis of freely available info at TimothySykes.com. The entry decision is apparently based on an undeniable break-out with rising volume, the chart looks strongly bullish at this point. Advances in the volume seem to lead and advances in price -- to lag.