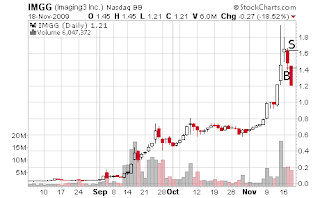

On TimothySykes.com, this is entered as a winning trade with sell level at $1.64, buy level at $1.42. There is little doubt that this is a short trade, initiated most likely early in the Nov 17th session. The company filed 10-Q on Nov 13, which triggered a rally. The following day it must have looked like the stock ran out of steam. It is interesting that when closing the trade, a powerful technical indicator (an opening with a downward gap) was ignored -- similarly to the way it was done for AWSL. Does ignoring technicals in the short trades begin to look like a feature of Tim's style? Something to be aware of when analyzing future trades.
Комментариев нет:
Отправить комментарий